September 15, 2015

iShares Core Total U.S. Bond Market ETF (AGG)

iShares Core Total U.S. Bond Market ETF (AGG) is a popular fixed income exchange traded fund. This fund invests in U.S. investment-grade bonds. This debt fund provides investor an access to high quality bond market.

This iShares fund objective is to provide stability & income. This bond fund has a low expense ratio fee of 0.08%. It current yield is 2.32%. It has $25 billion of assets. The current share price is $109.57. This intermediate-term bond ETF is tracking the Barclays US Aggregate Bond Index.

AGG Fund Profile

    iShares Core Total U.S. Bond Market ETF (AGG)
  • Fund Inception Date: 09/22/2003
  • Ticker Symbol: AGG
  • CUSIP: 464287226
  • Rank in category (YTD): 75% (YTD)
  • Category: Intermediate-Term Bond
  • Yield: 2.36%
  • Capital Gains: -
  • Expense Ratio: 0.05%
  • Total Assets: $ 45.20 billion
  • Annual Turnover Rate: 318%
updated on May 2017

iShares Core Total U.S. Bond Market ETF Returns

Morningstar has ranked this bond fund with 3 stars rating. In 2015, it has year-to-date return of 0.78% (up to August 20, 2015). This bond fund has returned 1.99% over the past 3 year, and 3.03% over the past 5 year.

September 13, 2015

Top 10 ETFs for 2016 & 2017: Part 2

Find part 2 of top 10 ETFs for 2016 & 2017 article. Best exchange traded funds are First Trust US IPO ETF, WisdomTree Total Dividend ETF, etc.

Best ETFs

If you start investing, you can find this article to be useful. This post provides variety of top ETFs for 2016 & 2017. The ETFs in this list are chosen from variety of sectors and categories. For 2016 & 2017, I still think we need to diversify our assets in stock and bond funds. Whether it is an up year or a down year, both stock and bond funds can provide a balance approach.

If you invest in brokerage or retirement account, please check the fund review below. You may find the expense fee, fund’s return, holdings, yield, etc. If you want to find best mutual fund, you can check my previous article as well.

If you miss part 1 article, please check the 10 best ETFs for 2016 & 2017.

The top 10 ETFs for 2016 & 2017 are:
    Top 10 ETFs for 2016 & 2017: Part 2
  1. Vanguard Total Stock Market ETF (VTI)
  2. iShares Core Total U.S. Bond Market ETF (AGG)
  3. WisdomTree SmallCap Dividend ETF (DES)
  4. PIMCO Total Return Active ETF (BOND)
  5. WisdomTree International LargeCap Dividend ETF (DOL)
  6. First Trust US IPO ETF (FPX)
  7. iShares J.P. Morgan USD Emerging Markets Bond ETF (EMB)
  8. Vanguard REIT Index Fund (VNQ)
  9. WisdomTree Total Dividend ETF (DTD)
  10. PowerShares QQQ ETF (QQQ)

First Trust US IPO ETF

The First Trust US IPO ETF has $851 million of assets. This fund is introduced to investor on April 12, 2006. It is tracking the IPOX(R)-100 U.S. Index. The yield is 0.60%. Its expense ratio is 0.60%.
Morningstar has ranked this large growth ETF with 5 stars rating. It has returned 26.85% over the past 3 year, and 24.02% over the past 5 year.

More: 8 Best ETFs For 2013

Top 5 stocks in its portfolio are Facebook Inc, AbbVie Inc, The Kraft Heinz Co, Phillips 66, and HCA Holdings Inc. Top 3 stock sectors are technology, consumer cyclical, and healthcare.

iShares J.P. Morgan USD Emerging Markets Bond ETF

This iShares J.P. Morgan USD Emerging Markets Bond ETF invests mainly in U.S. dollar-denominated government bonds issued by emerging market countries. This fund provide high yield for income. The current yield is 4.44%. IT has $4.55 billion of assets.

Morningstar has ranked this top ETF with 4 stars rating. In 2015, it has year-to-date return of 2.08%. It has a 3 years average return of 1.35%. The past 5 years performance is as follows:
  • Year 2014: 6.05%
  • Year 2013: -7.79%
  • Year 2012: 16.92%
  • Year 2011: 7.64%

Vanguard REIT Index Fund

This Vanguard REIT Index Fund objective is to provide a high level of income and moderate long-term capital appreciation. It is tracking the performance of a benchmark index, the MSCI U.S. REIT Index. If you want to invest in real estate, you should invest in this best Vanguard fund. The current yield is 3.86%. Its expense fee is quite low, only 0.12%.

Ranked with 3 stars rating by Morningstar, it has returned 10.60% over the past 3 year. The past 3 years performance is as follows:
  • Year 2015: -0.89% (YTD)
  • Year 2014: 30.36%
  • Year 2013: 2.31%
  • Year 2012: 17.63%

WisdomTree Total Dividend ETF

This WisdomTree Total Dividend ETF is a 4 star rating fund. This equity fund invests mainly in broad dividend-paying companies in the U.S. equity market. The expense fee is 0.28%. The SEC 30 day yield is 2.67%. It has $514 million of assets.

This stock fund has returned 12.95% over the past 3 years, and 15.28% over the past 5 years. Top 5 stocks in its holdings are Apple Inc, Exxon Mobil Corporation, AT&T Inc, Microsoft Corp, and Verizon Communications Inc.

PowerShares QQQ ETF

This PowerShares QQQ ETF has a low expense fee of 0.20%. The total net assets are $38 billion. It has a decent dividend yield of 1.36%. The current share price is $94.45. The price 52 week ranges are between $90.24 & $114.39.

More: Best ETFs Families 2015

This large growth fund is ranked with 5 star rating. It has a 5 year average return of 20.33%. It has returned 9.65% over the past 1 year, and 11.54% over the past decade.

September 12, 2015

10 Best ETFs for 2016 & 2017

Find top 10 ETFs for 2016 & 2017. Best exchange traded funds are Vanguard Total Stock Market ETF, WisdomTree SmallCap Dividend ETF, etc.

Top Funds

Investing in exchange traded funds is easy and popular due to its low cost. For 2016 & 2017, I still think we need to diversify our assets in stock and bond funds. Whether it is an up year or a down year, both stock and bond funds can provide a balance approach.

If you invest in brokerage or retirement account, please check the fund review below. You may find the expense fee, fund’s return, holdings, yield, etc. If you want to find best mutual fund, you can check my previous article as well.

The 10 best ETFs for 2016 & 2017 are:
    10 Best ETFs for 2016 & 2017
  1. Vanguard Total Stock Market ETF (VTI)
  2. iShares Core Total U.S. Bond Market ETF (AGG)
  3. WisdomTree SmallCap Dividend ETF (DES)
  4. PIMCO Total Return Active ETF (BOND)
  5. WisdomTree International LargeCap Dividend ETF (DOL)
  6. First Trust US IPO ETF (FPX)
  7. iShares J.P. Morgan USD Emerging Markets Bond ETF (EMB)
  8. Vanguard REIT Index Fund (VNQ)
  9. WisdomTree Total Dividend ETF (DTD)
  10. PowerShares QQQ ETF (QQQ)

Vanguard Total Stock Market ETF

Vanguard Total Stock Market ETF objective is to track the performance of CRSP US Total Market Index. It has dividend yield of 1.84%.

September 10, 2015

AllianzGI NFJ Dividend, Interest & Premium Strategy Fund (NFJ)

AllianzGI NFJ Dividend, Interest & Premium Strategy Fund (NFJ) is a popular closed end fund. It invests in common stocks, convertible and using option to enhance its returns. This fund has a high dividend yield of 12.74%.

The fund managers are Benno J. Fischer and Douglas Forsyth. This fund has $1.5 billion of assets. The fund sponsor is Allianz Global Investors Fund Management LLC. The expense fee is 0.95% per year. The current share price is $14.21. The market price is trading 12.77% discount from its NAV (Net Asset Value).

NFJ Fund Profile

    AllianzGI NFJ Dividend, Interest & Premium Strategy Fund (NFJ)
  • Fund Inception Date: 02/28/2005
  • Ticker Symbol: NFJ
  • CUSIP: 01883A107
  • Rank in category (YTD): 26%
  • Category: US Equity-Covered Call
  • Yield: 12.74%
  • Effective Leverage: -
  • Capital Gains: -
  • Premium/ Discount: -12.77%
  • Base Expense Ratio: 0.90%
  • Net Assets: $ 1.5 billion

September 9, 2015

Top 10 Large Growth ETFs in 2015

Find 20 best large growth ETFs in 2015. These large growth exchange traded funds are investing in big U.S. companies with high growth potential.

Best Large Growth Funds

These large growth funds invest in large U.S. companies that tend to grow faster than other large cap companies. These funds are aiming to invest on companies in rapidly expanding industries in term of earning, sales, book value, and cash flow. These companies also provide little to no dividend yield and have high price ratios.

These best large growth ETFs in 2015 are sorted based on its year to date performance in 2015 (up to August 16, 2015). You can find the fund details and review below. Some of these ETFs can be bought for free from variety of brokerages such as Fidelity, Schwab, TD Ameritrade, and Vanguard.

Top 10 large growth ETFs in 2015 are:
    Top 10 Large Growth ETFs in 2015
  1. UBS AG FI Enhanced Large Cap Growth ETN (FBGX)
  2. Credit Suisse FI Large Cap Growth Enhanced ETN (FLGE)
  3. First Trust US IPO ETF (FPX)
  4. Columbia Large Cap Growth ETF (RPX)
  5. SPDR MFS Systematic Growth Equity ETF (SYG)
  6. Columbia Select Large Cap Growth ETF (RWG)
  7. iShares Morningstar Large-Cap Growth ETF (JKE)
  8. iShares MSCI USA Momentum Factor ETF (MTUM)

September 8, 2015

Janus Triton Fund (JANIX)

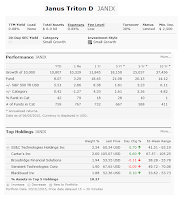
Janus Triton Fund (JANIX) is a popular US stock mutual fund. This fund invests its assets in common stocks selected for their growth potential. This investment fund uses its assets to purchase stocks of small- and medium-sized companies have a market capitalization of less than $10 billion. The fund may also invest in foreign securities, which may include investments in emerging markets.

This fund has $6.9 billion of assets. The fund manager is Jonathan D. Coleman. Its expense fee is 0.84%. The portfolio turnover rate is 30%. The fund has a yield of 0.08%. This class D fund has no sales load. The current share price is $25.29.

JANIX Fund Profile

    Janus Triton Fund | JANIX
  • Fund Inception Date: 02/25/2005
  • Ticker Symbol: JANIX
  • CUSIP: 47103E692
  • Beta (3yr): 0.95
  • Rank in category (YTD): 27%
  • Category: Small Growth
  • Yield: 0.08%
  • Capital Gains: -
  • Expense Ratio: 0.84%
  • Net Assets: $ 17.74 billion
  • Number of Years Up: 8 years
  • Number of Years Down: 1 year

September 6, 2015

Stock Market is in Turmoil for 2015

Is the stock market dead? During week 36, 2015, top stock market industries are memory chips semiconductor, and regional airlines stocks.

Top Equity Industries

This post will look into the top performing stocks, industry, and sector. The S&P 500 index has a weekly return of -3.36%. NASDAQ Composite has a weekly return of -2.99%. Dow Jones Industrials Average has a weekly return of -1.59%. The small cap (Russell 2000) has a return of -2.28%.

Stock market highlights for week 36 are:
    Stock Market is in Turmoil for 2015
  • Stocks are dropping to near low again. Stocks reverse course again and close in negative territory for 2015.
  • China’s slowdown can be felt regionally
  • Fed uncertain to raise or hold interest rates in near term
  • Technology sector may have little impact to China
  • Oil is stabilizing
Top 15 stock industries in week 36, 2015 (August 31, 2015 to September 6, 2015) are:

No.NamePerf WeekPerf MonthPerf YTD
1Semiconductor- Memory Chips4.67%-8.99%-48.18%
2Basic Materials Wholesale2.82%4.92%2.55%
3Regional Airlines1.83%-2.68%-4.27%
4Sporting Activities1.24%-2.01%7.25%
5Tobacco Products, Other0.91%-11.30%19.94%
6Internet Service Providers0.83%0.53%-59.90%
7Apparel Stores0.56%-3.39%1.97%
8Home Health Care0.54%-8.84%23.91%
9Electronics Stores0.37%8.02%4.09%
10Residential Construction0.14%1.42%8.05%
11Paper & Paper Products0.10%-2.38%-7.86%
12General Building Materials-0.06%-2.11%19.25%
13Drug Stores-0.06%-6.74%14.83%
14Textile Industrial-0.10%-7.01%12.52%
15Home Furnishing Stores-0.10%-6.00%-9.89%

Best Stocks Return

Looking into best weekly stocks can provide an insight what stock market will bring for the next session. Retail or institutional investors may want to rotate to this sector to avoid bad returns. Can growth stocks finally make the comeback? Will value stocks continue to be the winner? Some great sectors in 2015 are drug, health care, grocery, consumer, etc.

Top 4 memory chips semiconductor stocks in 2015 are:

No.CompanyTickerPerf WeekPerf MonthPerf Year
1Micron Technology, Inc.MU5.39%-10.15%-48.94%
2SunEdison Semiconductor LimitedSEMI1.27%-6.54%-27.23%
3Rambus Inc.RMBS0.45%1.27%10.11%
4Integrated Silicon Solution, Inc.ISSI0.09%0.87%49.15%
The 8 best regional airlines stocks in 2015 are:

No.CompanyTickerPerf WeekPerf MonthPerf Year
1Republic Airways Holdings Inc.RJET23.02%-13.98%-68.13%
2SkyWest Inc.SKYW7.26%-1.22%90.05%
3JetBlue Airways CorporationJBLU6.37%1.93%89.15%
4Alaska Air Group, Inc.ALK3.65%1.32%68.52%
5Ryanair Holdings plcRYAAY3.21%0.87%36.81%
6Hawaiian Holdings Inc.HA2.79%-1.30%53.52%
7Virgin America Inc.VA2.32%-3.90%-
8Southwest Airlines Co.LUV0.35%-1.35%14.16%
Top stock issues are:
  • Indices are bouncing lower again.
  • Oil is finally catching a bid.
  • Is China in trouble?
  • Bearish Divergence on stock charts gives warning to investors to skip stock markets for a while.

The Importance of Diversification in Investing

Diversification is a key principle in investing, and it's especially important in today's uncertain economic climate. By spreading y...