September 20, 2015

Precious Metals Stocks are back for 2015

Should you invest in precious metals stocks again? Will they become the top performer in 2016? During week 38, 2015, top stock market industries are silver stocks, and gold stocks.

Top Equity Industries

This post will look into the top performing stocks, industry, and sector. The S&P 500 index has a weekly return of -0.13%. NASDAQ Composite has a weekly return of 0.10%. Dow Jones Industrials Average has a weekly return of -0.29%. The small cap (Russell 2000) has a return of 0.51%.

Stock market highlights for week 38 are:
  • Federal Reserve decided to leave interest rates unchanged.
  • Stock Markets are down again.
  • Europe's Altice will buy Cablevision as it expands in US.
  • Global growth is still concerning.
  • Oil market is still trying to recover.
  • Biggest decliners in the Dow industrials are Goldman Sachs Group and J.P. Morgan Chase.
Top 25 stock industries in week 38, 2015 (September 14, 2015 to September 20, 2015) are:

No.NamePerf WeekPerf MonthPerf YTD
1Silver9.29%-8.53%-31.92%
2Long Distance Carriers8.38%10.05%8.25%
3Photographic Equipment & Supplies8.30%-35.36%-43.99%
4Gold7.86%-7.01%-23.35%
5REIT - Healthcare Facilities6.57%-4.62%-11.51%
6Dairy Products6.51%-3.27%-10.58%
7Drug Delivery6.49%-0.14%60.53%
8Basic Materials Wholesale5.86%2.37%4.47%
9Beverages - Brewers5.06%-0.70%-1.69%
10Internet Service Providers4.56%6.38%-58.80%
11CATV Systems3.72%-5.14%10.47%
12Water Utilities3.69%-2.37%-5.52%
13Research Services3.58%4.08%23.58%
14Multimedia & Graphics Software3.50%1.56%33.33%
15REIT - Retail3.30%-5.20%-4.19%
16Lumber, Wood Production3.21%-5.84%-13.53%
17REIT - Office3.18%-4.77%-5.13%
18Scientific & Technical Instruments3.13%-4.17%-9.83%
19REIT - Industrial2.91%-4.40%5.02%
20Nonmetallic Mineral Mining2.83%-5.56%-39.86%
21Diversified Utilities2.77%-8.26%-13.19%
22Air Services, Other2.76%-0.03%13.42%
23REIT - Residential2.74%-3.91%3.53%
24Gaming Activities2.64%-2.04%2.36%
25REIT - Diversified2.53%-5.02%-6.95%

Best Stocks Return

Looking into best weekly stocks can provide an insight what stock market will bring for the next session. Retail or institutional investors may want to rotate to this sector to avoid bad returns. Can growth stocks finally make the comeback? Will value stocks continue to be the winner? Some great sectors in 2015 are drug, health care, grocery, consumer, etc.

Top 11 silver stocks in 2015 are:

No.CompanyTickerPerf WeekPerf MonthPerf YTD
1Mines Management, Inc.MGN34.48%-6.92%-17.02%
2Hecla Mining Co.HL16.84%0.45%-20.15%
3Coeur Mining, Inc.CDE15.56%-16.13%-38.94%
4First Majestic Silver Corp.AG13.29%-17.97%-35.46%
5Silver Standard Resources Inc.SSRI13.28%-2.18%34.53%
6Pan American Silver Corp.PAAS12.70%0.12%-20.91%
7Fortuna Silver Mines Inc.FSM12.44%-13.48%-46.37%
8Silver Wheaton Corp.SLW6.71%-10.33%-38.32%
9MAG Silver Corp.MVG5.03%-8.05%-10.31%
10Endeavour Silver Corp.EXK4.58%-11.11%-25.93%
11Great Panther Silver LtdGPL0.12%-6.40%-34.55%
The 20 gold stocks in 2015 are:

No.CompanyTickerPerf WeekPerf MonthPerf YTD
1Timberline Resources CorporationTLR36.36%12.50%-23.42%
2Entree Gold Inc.EGI29.14%21.64%97.06%
3Golden Star Resources, Ltd.GSS23.16%11.43%11.43%
4IAMGOLD Corp.IAG21.77%-4.28%-33.70%
5Kinross Gold CorporationKGC21.71%-11.06%-34.40%
6International Tower Hill Mines Ltd.THM16.00%21.19%-35.56%
7Harmony Gold Mining Company LimitedHMY15.77%-20.91%-57.74%
8Eldorado Gold CorporationEGO15.69%-18.30%-47.68%
9AngloGold Ashanti Ltd.AU15.18%13.79%-2.30%
10McEwen Mining Inc.MUX14.29%0.00%-12.93%
11Silvercrest Mines Inc.SVLC14.28%-14.83%-28.91%
12Primero Mining Corp.PPP13.16%-18.10%-32.81%
13Lake Shore Gold Corp.LSG13.13%0.46%29.12%
14Alamos Gold, Inc.AGI11.90%14.08%-34.08%
15Sandstorm Gold Ltd.SAND11.76%-3.72%-16.18%
16Yamana Gold, Inc.AUY10.76%-23.58%-56.09%
17Agnico Eagle Mines LimitedAEM10.43%-6.78%-0.89%
18Comstock Mining, Inc.LODE10.00%8.20%-13.16%
19Gold Resource CorpGORO9.76%12.97%-20.12%
20New Gold, Inc.NGD9.65%5.49%-

September 19, 2015

PIMCO Total Return Active ETF (BOND)

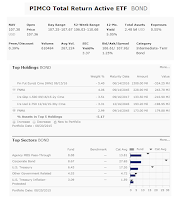
PIMCO Total Return Active ETF (BOND) is an actively managed bond exchange traded fund. It also has a high yield for income.

This PIMCO ETF is managed by Scott A. Mather, Mark R. Kiesel, and Mihir P. Worah. The current yield is 5.05%. The fund’s objective is to provide maximum total return, consistent with preservation of capital and prudent investment management. Its expense fee is 0.55%.

This fund invests in a diversified portfolio of Fixed Income Instruments of varying maturities. It may use forwards or derivatives such as options, futures contracts, or swap agreements. It mainly invest in investment grade bonds.

BOND Fund Profile

    PIMCO Total Return Active ETF (BOND)
  • Fund Inception Date: 02/29/2012
  • Ticker Symbol: BOND
  • CUSIP: 72201R775
  • Rank in category (YTD): 1%
  • Category: Intermediate-Term Bond
  • Yield: 5.05%
  • Capital Gains: -
  • Expense Ratio: 0.55%
  • Total Assets: $ 2.48 billion

September 17, 2015

Top 10 High Yield Closed End Funds for 2016

Find 10 best high yield closed end funds for 2016. These top funds are Eaton Vance Tax-Advantaged Global Dividend Income Fund, DoubleLine Income Solutions Fund, etc.

What is Closed End Funds?

Closed-end funds (CEFs) are different from mutual funds in some significant ways. For example, CEFs trade on market exchanges during the day, just like exchange-traded funds (ETFs). However, mutual funds and ETFs issue and redeem shares at their net asset value (NAV), so the number of shares fluctuates due to demand.

On the other hand, CEFs have a fixed number of shares. The price of a CEF is determined by supply and demand in the secondary market. The fund’s shares can trade at a persistent premium or discount to the underlying NAV (Net Asset Value).

Best High Dividend Funds

When we invest, we face with investing problem. Typically we have to sacrifice current yield. One of the choices to boost income is by investing in closed end funds. These funds may provide high dividend yield for income. Some of the funds may provide yield as high as 7-9%.
Top 10 High Yield Closed End Funds for 2016
These top 10 high yield closed end funds for 2016 are selected based on its performance, yield, and discount. These funds include several different classes such as bond funds, and stock funds. From this best funds list, you may find each individual fund review. You can find the fund performance, expense ratio, and yield or dividend from the table below.

Top 10 high yield closed end funds for 2016 are:
  1. DoubleLine Income Solutions Fund (DSL)
  2. Nuveen Premium Income Municipal Fund 4 Inc (NPT)
  3. PIMCO Dynamic Income Fund (PDI)
  4. BlackRock Corporate High Yield Fund Inc (HYT)
  5. Eaton Vance Tax-Advantaged Global Dividend Income Fund (ETG)

September 15, 2015

iShares Core Total U.S. Bond Market ETF (AGG)

iShares Core Total U.S. Bond Market ETF (AGG) is a popular fixed income exchange traded fund. This fund invests in U.S. investment-grade bonds. This debt fund provides investor an access to high quality bond market.

This iShares fund objective is to provide stability & income. This bond fund has a low expense ratio fee of 0.08%. It current yield is 2.32%. It has $25 billion of assets. The current share price is $109.57. This intermediate-term bond ETF is tracking the Barclays US Aggregate Bond Index.

AGG Fund Profile

    iShares Core Total U.S. Bond Market ETF (AGG)
  • Fund Inception Date: 09/22/2003
  • Ticker Symbol: AGG
  • CUSIP: 464287226
  • Rank in category (YTD): 75% (YTD)
  • Category: Intermediate-Term Bond
  • Yield: 2.36%
  • Capital Gains: -
  • Expense Ratio: 0.05%
  • Total Assets: $ 45.20 billion
  • Annual Turnover Rate: 318%
updated on May 2017

iShares Core Total U.S. Bond Market ETF Returns

Morningstar has ranked this bond fund with 3 stars rating. In 2015, it has year-to-date return of 0.78% (up to August 20, 2015). This bond fund has returned 1.99% over the past 3 year, and 3.03% over the past 5 year.

September 13, 2015

Top 10 ETFs for 2016 & 2017: Part 2

Find part 2 of top 10 ETFs for 2016 & 2017 article. Best exchange traded funds are First Trust US IPO ETF, WisdomTree Total Dividend ETF, etc.

Best ETFs

If you start investing, you can find this article to be useful. This post provides variety of top ETFs for 2016 & 2017. The ETFs in this list are chosen from variety of sectors and categories. For 2016 & 2017, I still think we need to diversify our assets in stock and bond funds. Whether it is an up year or a down year, both stock and bond funds can provide a balance approach.

If you invest in brokerage or retirement account, please check the fund review below. You may find the expense fee, fund’s return, holdings, yield, etc. If you want to find best mutual fund, you can check my previous article as well.

If you miss part 1 article, please check the 10 best ETFs for 2016 & 2017.

The top 10 ETFs for 2016 & 2017 are:
    Top 10 ETFs for 2016 & 2017: Part 2
  1. Vanguard Total Stock Market ETF (VTI)
  2. iShares Core Total U.S. Bond Market ETF (AGG)
  3. WisdomTree SmallCap Dividend ETF (DES)
  4. PIMCO Total Return Active ETF (BOND)
  5. WisdomTree International LargeCap Dividend ETF (DOL)
  6. First Trust US IPO ETF (FPX)
  7. iShares J.P. Morgan USD Emerging Markets Bond ETF (EMB)
  8. Vanguard REIT Index Fund (VNQ)
  9. WisdomTree Total Dividend ETF (DTD)
  10. PowerShares QQQ ETF (QQQ)

First Trust US IPO ETF

The First Trust US IPO ETF has $851 million of assets. This fund is introduced to investor on April 12, 2006. It is tracking the IPOX(R)-100 U.S. Index. The yield is 0.60%. Its expense ratio is 0.60%.
Morningstar has ranked this large growth ETF with 5 stars rating. It has returned 26.85% over the past 3 year, and 24.02% over the past 5 year.

More: 8 Best ETFs For 2013

Top 5 stocks in its portfolio are Facebook Inc, AbbVie Inc, The Kraft Heinz Co, Phillips 66, and HCA Holdings Inc. Top 3 stock sectors are technology, consumer cyclical, and healthcare.

iShares J.P. Morgan USD Emerging Markets Bond ETF

This iShares J.P. Morgan USD Emerging Markets Bond ETF invests mainly in U.S. dollar-denominated government bonds issued by emerging market countries. This fund provide high yield for income. The current yield is 4.44%. IT has $4.55 billion of assets.

Morningstar has ranked this top ETF with 4 stars rating. In 2015, it has year-to-date return of 2.08%. It has a 3 years average return of 1.35%. The past 5 years performance is as follows:
  • Year 2014: 6.05%
  • Year 2013: -7.79%
  • Year 2012: 16.92%
  • Year 2011: 7.64%

Vanguard REIT Index Fund

This Vanguard REIT Index Fund objective is to provide a high level of income and moderate long-term capital appreciation. It is tracking the performance of a benchmark index, the MSCI U.S. REIT Index. If you want to invest in real estate, you should invest in this best Vanguard fund. The current yield is 3.86%. Its expense fee is quite low, only 0.12%.

Ranked with 3 stars rating by Morningstar, it has returned 10.60% over the past 3 year. The past 3 years performance is as follows:
  • Year 2015: -0.89% (YTD)
  • Year 2014: 30.36%
  • Year 2013: 2.31%
  • Year 2012: 17.63%

WisdomTree Total Dividend ETF

This WisdomTree Total Dividend ETF is a 4 star rating fund. This equity fund invests mainly in broad dividend-paying companies in the U.S. equity market. The expense fee is 0.28%. The SEC 30 day yield is 2.67%. It has $514 million of assets.

This stock fund has returned 12.95% over the past 3 years, and 15.28% over the past 5 years. Top 5 stocks in its holdings are Apple Inc, Exxon Mobil Corporation, AT&T Inc, Microsoft Corp, and Verizon Communications Inc.

PowerShares QQQ ETF

This PowerShares QQQ ETF has a low expense fee of 0.20%. The total net assets are $38 billion. It has a decent dividend yield of 1.36%. The current share price is $94.45. The price 52 week ranges are between $90.24 & $114.39.

More: Best ETFs Families 2015

This large growth fund is ranked with 5 star rating. It has a 5 year average return of 20.33%. It has returned 9.65% over the past 1 year, and 11.54% over the past decade.

September 12, 2015

10 Best ETFs for 2016 & 2017

Find top 10 ETFs for 2016 & 2017. Best exchange traded funds are Vanguard Total Stock Market ETF, WisdomTree SmallCap Dividend ETF, etc.

Top Funds

Investing in exchange traded funds is easy and popular due to its low cost. For 2016 & 2017, I still think we need to diversify our assets in stock and bond funds. Whether it is an up year or a down year, both stock and bond funds can provide a balance approach.

If you invest in brokerage or retirement account, please check the fund review below. You may find the expense fee, fund’s return, holdings, yield, etc. If you want to find best mutual fund, you can check my previous article as well.

The 10 best ETFs for 2016 & 2017 are:
    10 Best ETFs for 2016 & 2017
  1. Vanguard Total Stock Market ETF (VTI)
  2. iShares Core Total U.S. Bond Market ETF (AGG)
  3. WisdomTree SmallCap Dividend ETF (DES)
  4. PIMCO Total Return Active ETF (BOND)
  5. WisdomTree International LargeCap Dividend ETF (DOL)
  6. First Trust US IPO ETF (FPX)
  7. iShares J.P. Morgan USD Emerging Markets Bond ETF (EMB)
  8. Vanguard REIT Index Fund (VNQ)
  9. WisdomTree Total Dividend ETF (DTD)
  10. PowerShares QQQ ETF (QQQ)

Vanguard Total Stock Market ETF

Vanguard Total Stock Market ETF objective is to track the performance of CRSP US Total Market Index. It has dividend yield of 1.84%.

September 10, 2015

AllianzGI NFJ Dividend, Interest & Premium Strategy Fund (NFJ)

AllianzGI NFJ Dividend, Interest & Premium Strategy Fund (NFJ) is a popular closed end fund. It invests in common stocks, convertible and using option to enhance its returns. This fund has a high dividend yield of 12.74%.

The fund managers are Benno J. Fischer and Douglas Forsyth. This fund has $1.5 billion of assets. The fund sponsor is Allianz Global Investors Fund Management LLC. The expense fee is 0.95% per year. The current share price is $14.21. The market price is trading 12.77% discount from its NAV (Net Asset Value).

NFJ Fund Profile

    AllianzGI NFJ Dividend, Interest & Premium Strategy Fund (NFJ)
  • Fund Inception Date: 02/28/2005
  • Ticker Symbol: NFJ
  • CUSIP: 01883A107
  • Rank in category (YTD): 26%
  • Category: US Equity-Covered Call
  • Yield: 12.74%
  • Effective Leverage: -
  • Capital Gains: -
  • Premium/ Discount: -12.77%
  • Base Expense Ratio: 0.90%
  • Net Assets: $ 1.5 billion

The Importance of Diversification in Investing

Diversification is a key principle in investing, and it's especially important in today's uncertain economic climate. By spreading y...