This post is about BPSPX Bullish Index (Chart of The Day) on
July 14, 2010. I provide stock analysis.

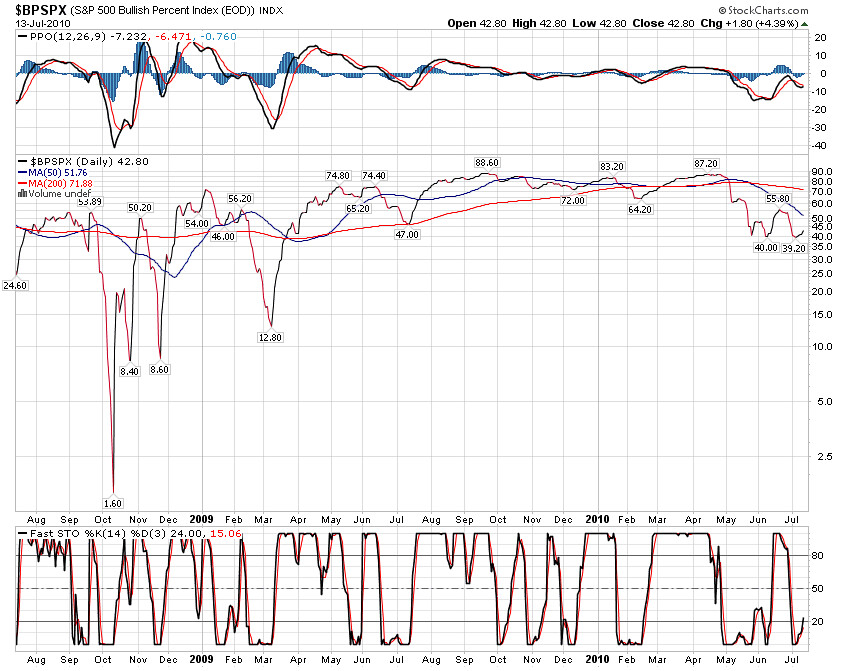
The BPSPX, also known as S&P 500 Bullish Percent Index, measures the breadth of the Standard & Poor's 500. Investors use the BPSPX to identify high and low levels of the S&P 500 index.
Many technical analysts use the BPSPX ($BPSPX at Stockcharts) to identify changes in the trend of the S&P 500.
The BPSPX, also known as S&P 500 Bullish Percent Index, measures the breadth of the Standard & Poor's 500. Investors use the BPSPX to identify high and low levels of the S&P 500 index.
Many technical analysts use the BPSPX ($BPSPX at Stockcharts) to identify changes in the trend of the S&P 500.
- A reading above 70% is considered overbought with 80 considered an extremely overbought situation. When the BPSPX falls through the 70 level a sell signal is given.
- Oversold signals are given when the BPSPX gives a reading below 30%, while 20% is considered a better oversold indication. The BPSPX Index gives buy signals when it turns up through the 30% threshold, reversing its downtrend.


No comments:
Post a Comment