August 31, 2015

T Rowe Price Overseas Stock Fund (TROSX)

T Rowe Price Overseas Stock Fund (TROSX) is a popular international stock mutual fund. It invests mainly in stocks of non-U.S companies. The fund objective is to provide capital growth.

This TRP fund utilizes its assets to purchase stocks of companies located in developed countries such as Germany, Spain, UK, Japan, etc. It may also invest in emerging markets around the world. Typically, the companies are considered as large cap companies. The fund manager is Raymond A. Mills.

This foreign large blend fund has $10.9 billion of assets. It has a decent dividend yield of 2.67%. The expense fee is only 0.84%. The current share price is $10.11. This T Rowe Price Overseas Stock fund has no sales load.

TROSX Fund Profile

    T Rowe Price Overseas Stock Fund (TROSX)
  • Fund Inception Date: 12/29/2006
  • Ticker Symbol: TROSX
  • CUSIP: 
  • Beta (3yr): 0.90
  • Rank in category (YTD): 47%
  • Category: Foreign Large Blend
  • Distribution Yield: 2.67%
  • Capital Gains: -
  • Expense Ratio: 0.84%
  • Net Assets: $ 10.9 billion
  • Number of Years Up: 5 years
  • Number of Years Down: 3 years

August 30, 2015

Leader Stocks Recover in 2015

Leader stocks recover from previous week big drop. During week 35, 2015, top stock market industries are oil & gas drilling & exploration, broad line semiconductor, etc.

Top Stock Industries

This post will look into the top performing stocks, industry, and sector. The S&P 500 index has a weekly return of 0.95%. NASDAQ Composite has a weekly return of 2.60%. Dow Jones Industrials Average has a weekly return of 1.17%. The small cap (Russell 2000) has a return of 0.56%.

Stock market highlights for week 35 are:
  • NYSE invokes Rule 48 to smooth out trading and ease volatility
  • Market Indices hold gains for week 35, 2015
  • Is China still slowing down?
  • Moody's reduces 2016 world expansion forecast to 2.8%
  • Research shows global GDP may be weaker than current data
Leader Stocks Recover in 2015
Top 25 stock industries in week 35, 2015 (August 24, 2015 to August 30, 2015) are:

No.NamePerf WeekPerf MonthPerf YTD
1Electronics Stores10.43%4.44%3.71%
2Internet Service Providers9.98%-13.57%-60.26%
3Semiconductor- Memory Chips8.71%-17.77%-50.50%
4Oil & Gas Drilling & Exploration8.58%-8.99%-23.47%
5Basic Materials Wholesale7.92%-2.13%-0.27%
6Semiconductor - Broad Line7.57%-3.40%-9.22%
7Copper6.88%-4.20%-29.02%
8Electronic Equipment6.74%-7.20%4.11%
9Oil & Gas Equipment & Services6.56%-5.88%-13.15%
10Semiconductor - Specialized6.30%-4.35%1.99%
11Semiconductor - Integrated Circuits5.95%-9.33%-3.76%
12Cement5.67%-2.17%7.71%
13Industrial Electrical Equipment5.59%-15.16%-24.52%
14Aluminum5.50%-5.01%-36.29%
15Conglomerates5.31%-6.74%-15.14%
16Drug Delivery5.13%-7.99%53.63%
17Jewelry Stores4.82%-0.06%-9.07%
18Multimedia & Graphics Software4.74%0.16%28.36%
19Independent Oil & Gas4.60%-6.16%-22.91%
20Shipping4.57%-8.54%-12.93%
21Catalog & Mail Order Houses4.18%-3.45%46.55%
22Specialty Eateries4.11%-4.61%30.44%
23Industrial Metals & Minerals4.09%-3.71%-21.70%
24Textile - Apparel Footwear & Accessories4.07%-2.80%12.14%
25Semiconductor Equipment & Materials4.03%-6.52%-15.80%

Best Stocks Return

Looking into best weekly stocks can provide an insight what stock market will bring for the next session. Retail or institutional investors may want to rotate to this sector to avoid bad returns. Can growth stocks finally make the comeback? Will value stocks continue to be the winner? Some great sectors in 2015 are drug, health care, grocery, consumer, etc.

Top 20 oil & gas drilling & exploration stocks in 2015 are:

No.CompanyTickerPerf WeekPerf MonthPerf Year
1Vanguard Natural Resources, LLCVNR50.08%-19.02%-63.48%
2Torchlight Energy Resources, Inc.TRCH31.42%10.39%-62.71%
3Breitburn Energy Partners LPBBEP28.89%-10.66%-85.49%
4Pioneer Energy Services Corp.PES27.35%-17.89%-79.66%
5Northern Oil and Gas, Inc.NOG25.97%15.71%-65.17%
6Halcon Resources CorporationHK23.53%0.00%-81.05%
7North Atlantic Drilling LimitedNADL23.44%-22.55%-92.65%
8Hugoton Royalty TrustHGT21.37%9.36%-65.17%
9Cross Timbers Royalty TrustCRT20.04%2.15%-45.75%
10Pengrowth Energy CorporationPGH19.27%-19.20%-77.30%
11ECA Marcellus Trust IECT18.33%-6.49%-63.31%
12SeaDrill LimitedSDRL16.52%-15.42%-78.00%
13Ocean Rig UDW Inc.ORIG15.02%-15.33%-80.59%
14Ensco plcESV14.52%7.22%-62.30%
15EV Energy Partners LPEVEP14.19%-11.92%-77.02%
16W&T Offshore Inc.WTI14.18%-20.10%-77.69%
17Enerplus CorporationERF14.16%-6.00%-71.56%
18Samson Oil & Gas LimitedSSN14.04%-6.93%-83.75%
19Nabors Industries Ltd.NBR13.89%-3.47%-55.89%
20SandRidge Energy, Inc.SD13.33%-8.93%-90.27%
The 20 best oil & gas drilling & exploration stocks in 2015 are:

No.CompanyTickerPerf WeekPerf MonthPerf Year
1Atmel CorporationATML18.13%-2.49%-3.47%
2Avago Technologies LimitedAVGO14.51%-0.02%69.32%
3AU Optronics Corp.AUO12.96%-12.86%-38.63%
4NeoPhotonics CorporationNPTN11.90%-19.41%168.23%
5Qorvo, Inc.QRVO11.60%-7.76%-
6Integrated Device Technology, Inc.IDTI10.41%-1.45%16.54%
7FormFactor Inc.FORM8.83%-13.05%-4.95%
8Cypress Semiconductor CorporationCY8.73%-13.17%-3.95%
9Maxim Integrated Products, Inc.MXIM8.29%-0.01%13.37%
10NXP Semiconductors NVNXPI7.97%-11.38%29.53%
11ON Semiconductor Corp.ON7.63%-7.84%2.28%
12Intel CorporationINTC7.00%-0.88%-15.55%
13Inphi CorporationIPHI6.75%5.71%58.88%
14Freescale Semiconductor, Ltd.FSL6.65%-9.12%74.23%
15Kopin CorporationKOPN6.25%1.32%-24.44%
16STMicroelectronics NVSTM4.72%-5.67%-6.52%
17M/A-Com Technology Solutions Holdings, Inc.MTSI4.44%-10.79%30.63%
18Texas Instruments Inc.TXN4.42%-4.48%2.59%
19Intersil CorporationISIL4.02%-5.07%-24.57%
20Advanced Micro Devices, Inc.AMD3.93%-4.15%-55.31%
Top stock issues are:
  • Indices are bouncing.
  • Oil is finally catching a bid.
  • Is China in trouble?

Other News

On Friday, a regulatory filing says Berkshire Hathaway (BRK.A) has accumulated about 58 million shares, which amounts to more than 10% of the Phillips 66 (PSX), Houston company's stock.

Previously in late 2013, the Berkshire Hathaway agreed to trade about $1.4 billion of its Phillips 66 (PSX) stock for one of the refiner's businesses that makes additives to help crude oil flow through pipelines.

Many investors watch Berkshire Hathaway filings closely. They may try to copy Buffett's moves, given his successful record. Known as Oracle of Omaha, Buffett, has been running the company for more than 50 years, a period in which he has built a net worth of more than $70 billion. He has managed to push Berkshire's share price up to hundreds of thousands of dollars.

August 28, 2015

Top 8 Mutual Funds for 2016 & 2017

Find top 8 mutual funds for 2016 & 2017. The best mutual funds are DoubleLine Total Return Bond Fund, Vanguard Balanced Index fund, etc.

Best Mutual Funds

Not all mutual funds make good investments; you need to select the right funds. Based on my research and experience, I believe the following 8 mutual funds are good choice for your 2016 investment. Out of over 22,000 mutual funds that I have searched, I consider these 8 funds to be the best. You may wish to consider these mutual funds as part of a balanced investment portfolio.

You can find different categories of mutual funds such as bond, stock, and balanced fund. I also provide each fund review for your information. Other information such as expense ratio, yield, sector, category, fund performance, fund ranking, top holdings, and bond rating can be found below. All of these best mutual funds are no load mutual funds.

Top 8 Mutual Funds for 2016 & 2017The top 8 mutual funds for 2016 & 2017 are:
  1. DoubleLine Total Return Bond Fund (DLTNX)
  2. Vanguard Total Stock Market Index Fund (VTSMX) 
  3. USAA Tax Exempt Intermediate-Term (USATX)
  4. T. Rowe Price International Discovery Fund (PRIDX)
  5. DoubleLine Emerging Markets Fixed Income Fund (DLENX)
  6. Vanguard Emerging Markets Stock Index (VEIEX)

August 27, 2015

BlackRock Credit Allocation Income Fund (BTZ)

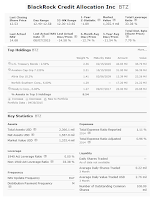
BlackRock Credit Allocation Income Fund (BTZ) is a popular bond closed end fund. This fund invests mainly in credit-related securities and securities with similar economic characteristics. The fund objective is to provide income with capital preservation.

This BlackRock fund is managed by Stephan Bassas, Jeffrey Cucunato, and Mitchel Garfin. It has a high yield of 7.83%. The fund sponsor is Blackrock Advisors. The current share price is $12.36. It has $2.37 billion of assets.

BTZ Fund Profile

    BlackRock Credit Allocation Income Fund (BTZ)
  • Fund Inception Date: 12/27/2006
  • Ticker Symbol: BTZ
  • CUSIP: 092508100
  • Rank in category (YTD): 12%
  • Category: Taxable Bond Fund
  • Distribution Rate: 7.83%
  • Effective Leverage: 32.45%
  • Capital Gains: -
  • Base Expense Ratio: 0.95%
  • Net Assets: $ 2.37 billion

August 26, 2015

DoubleLine Emerging Markets Fixed Income Fund (DLENX)

DoubleLine Emerging Markets Fixed Income Fund (DLENX) is a highly ranked bond mutual fund. It provide high yield for income.

DoubleLine Emerging Markets Fixed Income Fund utilizes its assets to purchase bonds of at least four emerging market countries. It may invest in defaulted corporate securities, and hybrid securities relating to emerging market countries. This fund is managed by Luz M. Padilla. The current dividend yield is 4.94%. Its expense fee is 1.15% per year.

DLENX Fund Profile

    DoubleLine Emerging Markets Fixed Income Fund (DLENX)
  • Fund Inception Date: 04/06/2010
  • Ticker Symbol: DLENX
  • CUSIP: 258620608
  • Beta (3yr): 0.72
  • Rank in category (YTD): 14%
  • Category: Emerging Markets Bond
  • Distribution Yield: 4.94%
  • Capital Gains: -
  • Expense Ratio: 1.15%
  • Net Assets: $ 963 million
  • Number of Years Up: 3 years
  • Number of Years Down: 1 year

August 24, 2015

12 Best Intermediate Term Bond ETFs in 2015

Intermediate term bond ETFs are popular among investors who seek higher income. These top exchange traded funds are iShares CMBS Fund, PIMCO Total Return Active ETF.

Top Bond Funds

Intermediate-Term Bond ETFs invest in fixed income securities with durations between five and ten years. These bond funds provide income for yield. The funds invest in government bonds (US Treasuries) and corporate bonds.

These top intermediate-term bond funds are selected based on its YTD performance in 2015 (up to July 26, 2015). Unlike mutual fund, these exchange traded funds don’t have a sales load or a transaction fee. You can find the fund review and other fund information below such as the yield, expense ratio, fund manager, top holdings, top sectors, etc.

The 12 best intermediate term bond ETFs in 2015 are:
    12 Best Intermediate Term Bond ETFs in 2015
  1. iShares CMBS ETF (CMBS)
  2. PIMCO Total Return Active ETF (BOND)
  3. iShares Core Total USD Bond Market ETF (IUSB)
  4. SPDR Barclays Mortgage Backed Bond ETF (MBG)
  5. iShares Intermediate Government/Credit Bond ETF (GVI)
  6. Vanguard Mortgage-Backed Securities ETF (VMBS)
  7. Vanguard Intermediate-Term Bond ETF (BIV)
  8. Fidelity Total Bond ETF (FBND)
  9. iShares MBS ETF (MBB)
  10. Columbia Core Bond ETF (GMTB)

August 23, 2015

Merrill Edge Online Brokerage

Merrill Edge is part of Bank of America since 2009. It provides online brokerage for investor. As part of Merrill Lynch service, Merrill Edge is a full service broker that offers stocks, ETFs, and option trading. Any investor and trader can open a Merrill Edge account.

If you are Bank of America customer, you may even qualify for free monthly trades. For current banking customers, you might want to consider Merrill Edge as your main broker.

Broker Profile

    Merrill Edge Stock Broker
  • Products: Stocks, ETFs, fixed income & bonds, mutual funds, CDs, IPOs, options, annuities
  • Stock Orders: $6.95 per trade
  • ETF Orders: $6.95 per trade
  • Broker Assisted: $29.95 per trade
  • Mutual Funds: $0.00 for NTF funds. Non-NTF: $19.95/trade or $29.95/trade
  • Options: $6.95/trade+$0.75/contract
  • Exercised:  $6.95 per trade
  • Minimum to Open: $0
  • Inactivity Fee: $0.00
  • Full Account Transfer Fee: $49.95
  • Some Other Fees: Wire Transfer Fee: 24.95
  • Maximum Margin Rate: Check current website for details.

Commissions & Fees

You can buy and sell stocks, ETFs, and options. Regular stock trades are a flat $6.95 per trade. There are no additional charges for stocks less than $1 per share.

August 22, 2015

Leader Stocks See Red in 2015

Leader stocks were going down during week 34, 2015. Is the bottom finally in? Will you see more pain in upcoming weeks? Top stock market industries are gold, residential construction, etc.

Top Stock Industries

This post will look into the top performing stocks, industry, and sector. The S&P 500 index has a weekly return of -5.71%. NASDAQ Composite has a weekly return of -6.78%. Dow Jones Industrials Average has a weekly return of -5.71%. The small cap (Russell 2000) has a return of -2.66%.

Stock market highlights for week 34 are:
    Leader Stocks See Reds in 2015
  • Major indices around the world tumble. 
  • Dow Jones industrial average tumbles 530 points last Friday.
  • Slowdown concerns in China shook markets.
  • Stock leaders such as Google (GOOGL) and Facebook (FB) tumble close to 5% in 1 day.
  • Gold stocks are outperforming other sectors.
  • Oil is still going down.
Top 25 stock industries in week 33, 2015 (August 10, 2015 to August 16, 2015) are:

No.NamePerf WeekPerf MonthPerf Quart
1Gold7.00%14.94%-22.17%
2Residential Construction0.42%3.52%7.49%
3Appliances-0.09%-1.27%-7.45%
4Silver-0.15%9.56%-27.47%
5Computers Wholesale-0.53%5.66%-2.50%
6Tobacco Products, Other-0.81%-12.14%1.66%
7Water Utilities-1.56%0.06%-4.52%
8Electric Utilities-1.60%4.23%-1.17%
9REIT - Industrial-1.72%3.26%4.33%
10Management Services-1.89%-1.75%-2.16%
11Jewelry Stores-1.92%-5.29%-4.80%
12REIT - Retail-2.08%2.33%-1.81%
13Department Stores-2.24%-4.35%-6.37%
14Dairy Products-2.25%-6.56%-10.36%
15Telecom Services - Domestic-2.28%-0.78%-5.18%
16REIT - Residential-2.40%0.12%0.40%
17Waste Management-2.47%4.23%0.66%
18REIT - Office-2.48%-2.21%-4.14%
19Meat Products-2.51%-1.39%-0.71%
20Home Improvement Stores-2.52%2.35%3.58%
21Wireless Communications-2.60%-2.79%-8.90%
22Paper & Paper Products-2.70%-2.81%-10.07%
23Diversified Utilities-2.79%1.50%-7.18%
24Metal Fabrication-2.93%6.70%-9.35%
25Gas Utilities-2.94%1.22%-5.84%

Best Stocks Return

Looking into best weekly stocks can provide an insight what stock market will bring for the next session. Retail or institutional investors may want to rotate to this sector to avoid bad returns. Can growth stocks finally make the comeback? Will value stocks continue to be the winner? Some great sectors in 2015 are drug, health care, grocery, consumer, etc.

Top 20 gold stocks in 2015 are:

No.CompanyTickerPerf WeekPerf Month
1Gold Fields Ltd.GFI33.96%26.33%
2AngloGold Ashanti Ltd.AU30.08%24.12%
3Alamos Gold, Inc.AGI20.72%41.88%
4Seabridge Gold, Inc.SA17.79%89.68%
5DRDGOLD Ltd.DRD17.70%3.10%
6Sibanye Gold LimitedSBGL15.19%-11.65%
7B2Gold Corp.BTG12.28%17.43%
8Primero Mining Corp.PPP11.66%22.96%
9Timmins Gold Corp.TGD11.44%0.82%
10Asanko Gold Inc.AKG10.90%19.31%
11Agnico Eagle Mines LimitedAEM10.46%17.02%
12Harmony Gold Mining Company LimitedHMY10.20%6.93%
13Gold Resource CorpGORO8.86%24.04%
14Goldcorp Inc.GG8.54%21.37%
15Randgold Resources LimitedGOLD6.01%12.76%
16Minco Gold CorporationMGH5.26%4.17%
17Gold Standard Ventures CorpGSV5.00%20.44%
18Franco-Nevada CorporationFNV4.97%17.55%
19Lake Shore Gold Corp.LSG4.76%3.51%
20Newmont Mining CorporationNEM4.55%3.07%
The 11 best residential construction stocks in 2015 are:

No.CompanyTickerPerf WeekPerf Month
1UCP, Inc.UCP8.07%17.71%
2Hovnanian Enterprises Inc.HOV5.73%-25.89%
3Taylor Morrison Home CorporationTMHC2.29%4.05%
4Comstock Holding Companies, Inc.CHCI1.87%15.51%
5Lennar CorporationLEN1.73%1.89%
6M/I Homes, Inc.MHO1.58%5.96%
7DR Horton Inc.DHI1.21%13.30%
8NVR, Inc.NVR1.05%6.35%
9WCI Communities Inc.WCIC0.97%11.04%
10TRI Pointe Group, Inc.TPH0.34%0.54%
11Toll Brothers Inc.TOL0.28%3.96%
Top stock issues are:
  • Indices are going down.
  • Oil is still down.
  • Is China in trouble?

August 21, 2015

Accident & Health Insurance Stocks

Accident & Health Insurance Stocks is part of financials stock sector. These companies provide supplemental insurance and reinsurance products & services to individuals and businesses.

These insurance products include worker compensation benefits, group benefits, and private health insurance. The companies are generally structured as large corporations. They offer below-average dividend yields than typical S&P 500 index.

Accident & Health Insurance Companies List

These industry stocks have several top companies. Top 3 accident & health insurance companies are AFLAC Inc, Unum Group, and Assurant Inc.

Accident & Health Insurance companies are:
    Accident & Health Insurance Stocks
  1. AFLAC Inc. (AFL)
  2. Unum Group (UNM)
  3. Assurant Inc. (AIZ)
  4. CNO Financial Group, Inc. (CNO)
  5. StanCorp Financial Group Inc. (SFG)
  6. ProAssurance Corporation (PRA)
  7. Greenlight Capital Re, Ltd. (GLRE)
  8. Employers Holdings, Inc. (EIG)
  9. Triple-S Management Corporation (GTS)
  10. Trupanion, Inc. (TRUP)

August 20, 2015

Templeton Global Total Return Fund (TGTRX) Class A

Templeton Global Total Return Fund (TGTRX) is a popular world bond mutual fund. It invests in fixed and floating rate debt securities and debt obligations (including convertible bonds) of governments, government-related or corporate issuers worldwide. This fund has a high yield for income.

This bond fund is managed by Michael J. Hasenstab and Sonal Desai. The current yield is 7.86%. It has an expense fee of 1.01%. This class A fund has a sales load of 4.25%. It has $8.3 billion of assets. You can invest in this fund with $1,000 initial investment.

TGTRX Fund Profile

    Templeton Global Total Return Fund (TGTRX) Class A
  • Fund Inception Date: 09/30/2008
  • Ticker Symbol: TGTRX
  • CUSIP: 880208889
  • Beta (3yr): 0.65
  • Rank in category (YTD): 15%
  • Category: World Bond
  • Distribution Yield: 7.86%
  • Capital Gains: -
  • Expense Ratio: 1.01%
  • Net Assets: $ 8.3 billion
  • Number of Years Up: 5 years
  • Number of Years Down: 1 year

August 18, 2015

Top 8 Preferred Stock ETFs in 2015

Find top 8 preferred stock ETFs in 2015. These best exchange traded funds are First Trust Preferred Securities and Income ETF, PowerShares Financial Preferred fund.

Best Preferred Equity Funds

Preferred stock funds invest mainly in preferred stocks and perpetual bonds. These portfolios tend to have more credit risk than government or agency backed bonds. The fund has an effective duration longer than other bond portfolios. These portfolios hold more than 65% of assets in preferred stocks and perpetual bonds.

These top ETFs are sorted based on its year to date return performance (up to July 19, 2015). You can find this best ETF funds review from this article. Other fund information can be found below such as expense ratio, Morningstar rating, fund’s NAV, holdings, yield, etc.

Top 8 preferred stock ETFs in 2015 are:
    Top 8 Preferred Stock ETFs in 2015
  1. First Trust Preferred Securities and Income ETF (FPE)
  2. PowerShares Financial Preferred ETF (PGF)
  3. PowerShares Variable Rate Preferred ETF (VRP)
  4. PowerShares Preferred ETF (PGX)
  5. SPDR Wells Fargo Preferred Stock ETF (PSK)
  6. iShares US Preferred Stock ETF (PFF)
  7. Market Vectors Preferred Securities ex Financials ETF (PFXF)

August 17, 2015

Vanguard Balanced Index Fund (VBINX) Investor Shares

Vanguard Balanced Index Fund (VBINX) is a popular balanced mutual fund. This investor shares fund invests in stocks and bonds. It also provides dividend yield for income.

The fund objective is to track the performance of a broad, market-weighted bond index and a benchmark index that measures the investment return of the overall U.S. stock market. This mutual fund is using 60% of its assets to track the investment performance of the CRSP U.S. Total Market Index and approximately 40% of its assets to track the investment performance of the Barclays U.S. Aggregate Float Adjusted Index.

VBINX Fund Profile

    Vanguard Balanced Index Fund (VBINX) Investor Shares
  • Fund Inception Date: November 9, 1992
  • Ticker Symbol: VBINX (Investor Shares)
  • CUSIP: 921931101
  • Beta (3yr): 0.92
  • Rank in category (YTD): 48%
  • Category: Moderate Allocation
  • Yield: 1.81%
  • Capital Gains: 0%
  • Expense Ratio: 0.23%  
  • Net Assets: $ 26.50 billion
  • Number of Years Up: 17 years
  • Number of Years Down: 5 years

August 15, 2015

Silver & Gold Stocks are making a comeback in 2015

Silver & gold stocks are making a comeback in 2015. Should you invest in them now? Top stock market industries during week 33, 2015 are silver, metal fabrication, gold, etc.

Top Stock Industries

This post will look into the top performing stocks, industry, and sector. The S&P 500 index has a weekly return of 0.73%. NASDAQ Composite has a weekly return of 0.09%. Dow Jones Industrials Average has a weekly return of 0.67%. The small cap (Russell 2000) has a return of 0.52%.
Gold & Silver Stocks are Going Up
Stock market highlights for week 33 are:
  • Google creates a new holding company, “Alphabet”.
  • Oil is still going lower. WTI was closed at $42.23.
  • Berkshire Hathaway will buy Precision Castparts for $32 billion.
Top 25 stock industries in week 33, 2015 (August 10, 2015 to August 16, 2015) are:

No.NamePerf WeekPerf MonthPerf Quart
1Silver11.43%-6.36%-30.43%
2Metal Fabrication10.66%6.98%-6.85%
3Basic Materials Wholesale8.81%-0.67%-18.09%
4Food Wholesale8.40%6.24%7.08%
5Gold8.02%-10.86%-30.60%
6Electronics Stores6.03%-4.80%0.26%
7Auto Parts Stores5.22%8.06%13.51%
8Residential Construction4.95%2.31%8.39%
9Aluminum4.68%-6.91%-36.40%
10Oil & Gas Refining & Marketing4.61%-1.15%1.71%
11Building Materials Wholesale4.48%4.20%-5.47%
12Rubber & Plastics4.10%3.78%4.10%
13Appliances4.06%3.87%-5.46%
14Oil & Gas Pipelines3.91%-7.66%-16.47%
15Independent Oil & Gas3.54%-7.47%-20.70%
16Rental & Leasing Services3.28%-2.48%-12.93%
17Pollution & Treatment Controls3.11%-3.23%-8.77%
18Diversified Utilities2.99%-0.50%-3.74%
19Toys & Games2.93%-1.81%-0.12%
20Home Furnishings & Fixtures2.90%4.50%11.46%
21Drug Related Products2.90%5.75%2.36%
22Technical & System Software2.85%5.67%5.35%
23Home Improvement Stores2.81%4.78%3.78%
24Networking & Communication Devices2.72%2.21%0.22%
25General Building Materials2.64%6.68%6.34%

Best Stocks Return

Looking into best weekly stocks can provide an insight what stock market will bring for the next session. Retail or institutional investors may want to rotate to this sector to avoid bad returns. Can growth stocks finally make the comeback? Will value stocks continue to be the winner? Some great sectors in 2015 are drug, health care, grocery, consumer, etc.

Top 11 silver stocks in 2015 are:

No.CompanyTickerPerf WeekPerf Month
1Coeur Mining, Inc.CDE35.66%-22.96%
2Endeavour Silver Corp.EXK27.01%0.58%
3First Majestic Silver Corp.AG24.09%-18.08%
4Great Panther Silver LtdGPL20.03%5.32%
5Silver Standard Resources Inc.SSRI19.44%1.91%
6Hecla Mining Co.HL17.30%-9.21%
7Pan American Silver Corp.PAAS15.33%-9.66%
8Silvercorp Metals Inc.SVM15.23%-4.56%
9MAG Silver Corp.MVG7.73%9.86%
10Silver Wheaton Corp.SLW7.01%-4.09%
11Fortuna Silver Mines Inc.FSM2.97%-14.77%
The 14 best metal fabrication stocks in 2015 are:

No.CompanyTickerPerf WeekPerf Month
1Precision Castparts Corp.PCP18.89%19.69%
2Highway Holdings LimitedHIHO14.32%2.36%
3Constellium N.VCSTM7.34%-32.24%
4SIFCO Industries Inc.SIF7.30%-12.28%
5ARC Group Worldwide, Inc.ARCW6.30%-23.03%
6Shiloh Industries Inc.SHLO4.66%-3.66%
7Tenaris S.A.TS4.16%2.55%
8Metalico Inc.MEA4.08%2.00%
9A. M. Castle & Co.CAS4.08%-41.24%
10Carpenter Technology Corp.CRS2.87%2.20%
11Haynes International, Inc.HAYN1.81%-10.89%
12Mueller Industries Inc.MLI1.17%-7.39%
13Valmont Industries, Inc.VMI0.68%-6.30%
14Graham CorporationGHM0.17%-6.03%
Top 20 gold stocks in 2015 are:

No.CompanyTickerPerf WeekPerf Month
1McEwen Mining Inc.MUX32.48%12.80%
2Seabridge Gold, Inc.SA24.61%4.66%
3Rubicon Minerals CorporationRBY20.67%-4.67%
4Silvercrest Mines Inc.SVLC20.00%15.91%
5Eldorado Gold CorporationEGO18.31%5.58%
6Alamos Gold, Inc.AGI18.30%-17.91%
7Yamana Gold, Inc.AUY17.65%-13.04%
8Sandstorm Gold Ltd.SAND15.51%-9.58%
9Entree Gold Inc.EGI15.38%-3.81%
10IAMGOLD Corp.IAG14.10%4.71%
11Solitario Exploration & Royalty Corp.XPL12.22%-1.79%
12Lake Shore Gold Corp.LSG12.00%-9.86%
13Comstock Mining, Inc.LODE11.61%22.55%
14NovaGold Resources Inc.NG11.58%12.66%
15New Gold, Inc.NGD11.33%-17.22%
16Exeter Resource CorporationXRA9.60%4.38%
17Barrick Gold CorporationABX9.09%-16.88%
18AngloGold Ashanti Ltd.AU9.08%-21.58%
19B2Gold Corp.BTG8.57%-17.99%
20Franco-Nevada CorporationFNV8.54%-0.94%
Top stock issues are:
  • Indices are going up.
  • Oil is down.

August 14, 2015

Top 10 Equity Precious Metals Mutual Funds in 2015

Find best equity precious metals mutual funds in 2015. The top funds are U.S. Global Investors Gold and Precious Metals Fund, First Eagle Gold Fund.

Gold & Silver Funds

Precious metals sector has been performing poorly for the past 4 years. In 2015, this sector has been lagging other sectors. Whether it is a bear market again, investors need to observe this sector more closely. As one of the precious metals, gold is among the top investment for most investors. The other precious metals include silver, palladium, and platinum.
Top 10 Equity Precious Metals Mutual Funds in 2015

The following top performing gold mutual funds are sorted based on its year to date performance in 2015. You can buy these funds for your investment brokerage account or retirement account (traditional IRA or Roth IRA). You may also invest in 401k plan if this gold fund is available for investing.

Top 10 equity precious metals mutual funds in 2015 are:
  1. U.S. Global Investors Gold and Precious Metals Fund (USERX)
  2. U.S. Global Investors World Precious Minerals Fund (UNWPX)
  3. First Eagle Gold Fund Class A (SGGDX)
  4. Fidelity Select Gold Portfolio Fund (FSAGX)
  5. Franklin Gold and Precious Metals Fund Class A (FKRCX)
  6. Vanguard Precious Metals And Mining Fund (VGPMX)
  7. Gabelli Gold Fund Class AAA (GOLDX)
  8. Gabelli Gold Fund Class A (GLDAX)

August 13, 2015

Agricultural Chemicals Stocks

Agricultural chemicals stocks are part of basic materials stock sector. Agricultural chemical companies develop and sell agricultural fertilizers, nutrients, and pesticides. They also sell others industrial products. Agricultural chemical companies are usually structured as big corporation.

These agricultural chemical companies may provide dividend yields. The yield may vary widely and can be volatile due to changing commodity prices. The sector offers slightly above-average dividend yields.

Agricultural Chemicals Companies List

An agricultural chemical is any chemical or supplement that is applied to agricultural land to enhance crop yields. Farmers can maximize their production by enhancing soil with fertilizers or preventing disease using fungicides. Some companies have taken this development so far as to genetically alter seeds to prevent disease and resist insects.

Agricultural chemicals companies are:
    Agricultural Chemicals Stocks
  1. E. I. du Pont de Nemours and Company (DD)
  2. Monsanto Company (MON)
  3. Syngenta AG (SYT)
  4. Potash Corp. of Saskatchewan, Inc. (POT)
  5. The Mosaic Company (MOS)
  6. Agrium Inc. (AGU)
  7. CF Industries Holdings, Inc. (CF)
  8. Israel Chemicals Ltd. (ICL)
  9. The Scotts Miracle-Gro Company (SMG)
  10. Terra Nitrogen Company, L.P. (TNH)

August 12, 2015

Vanguard Growth ETF (VUG)

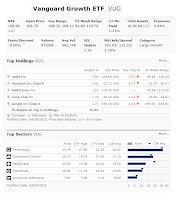
Vanguard Growth ETF (VUG) is a popular stock exchange trade fund. This equity ETF invests in large-capitalization growth stocks. This fund is tracking the performance of the CRSP US Large Cap Growth Index.

This Vanguard fund has a low expense fee of 0.09%. With assets of $18.96 billion, it has a dividend yield of 1.21%. This investment fund also has a low annual holdings turnover rate of 9%. This index fund is passively managed by Vanguard Equity Investment Group.

VUG Fund Profile

    Vanguard Growth ETF (VUG)
  • Fund Inception Date: 01/26/2004
  • Ticker Symbol: VUG
  • CUSIP: 922908736
  • Rank in category (YTD): 70%
  • Category: Large Growth
  • Yield: 1.21%
  • Capital Gains: -
  • Expense Ratio: 0.09%
  • Total Assets: $ 18.96 Billion
  • Average Volume: 682k

August 11, 2015

Top 6 High Yield Municipal Bond Closed End Funds 2015

Find top 6 high yield municipal bond closed end funds 2015. These best muni bond funds are Nuveen Muni High Income Opportunity Fund, MFS High Yield Municipal Trust.

Best High Yield Muni Funds

High yield municipal bond funds invest mainly in low quality municipal debts. These bond funds may provide high yield income for you. The yield may be tax free from federal income tax and possibly state income tax.

Whether you should invest in these top performing municipal bond closed end funds, you need to do details research. You can buy these CEF funds using your brokerage for your investment account, retirement account, etc.

These investment funds are managed actively by the fund manager(s). Find the fund review below. The funds are sorted based on its performance in 2015 (up to August 7, 2015).

Top 6 high yield municipal bond closed end funds 2015 are:
    High Yield Municipal Bond Closed End Funds
  1. Nuveen Muni High Income Opportunity Fund (NMZ)
  2. MFS High Yield Municipal Trust (CMU)
  3. MFS Municipal Income Fund (MFM)
  4. MFS High Income Municipal Fund (CXE)
  5. Pioneer Municipal High Income Fund (MHI)

August 9, 2015

Oil is down, what stocks are up during week 32, 2015?

Oil is still going down. What stocks are moving up then during week 32, 2015? Top stock market industries are home health care, multimedia & graphics software, etc.

Top Stock Industries

Stocks CrashThis post will look into the top performing stocks, industry, and sector. The S&P 500 index has a weekly return of -1.18%. NASDAQ Composite has a weekly return of -1.65%. Dow Jones Industrials Average has a weekly return of -1.65%. The small cap (Russell 2000) has a return of -2.54%.

More: Rotate To Banks And Hospitals Stocks

Top 25 stock industries in week 32, 2015 (August 3, 2015 to August 9, 2015) are:

No.NamePerf WeekPerf MonthPerf Quart
1Home Health Care7.73%17.46%33.66%
2Building Materials Wholesale7.05%-1.43%-6.91%
3Multimedia & Graphics Software4.88%5.83%10.04%
4Rubber & Plastics3.07%3.96%2.76%
5Major Airlines3.06%7.19%-3.13%
6Internet Software & Services2.39%4.20%5.62%
7Diversified Investments2.32%2.78%0.28%
8Housewares & Accessories2.24%7.25%8.04%
9Regional Airlines1.98%8.68%-2.71%
10Specialized Health Services1.97%3.33%4.99%
11Beverages - Soft Drinks1.71%5.33%4.21%
12Steel & Iron1.66%-1.90%-19.77%
13Photographic Equipment & Supplies1.46%20.86%25.25%
14Diversified Communication Services1.43%6.43%5.55%
15Staffing & Outsourcing Services1.35%0.02%1.10%
16Resorts & Casinos1.32%6.87%9.51%
17Confectioners1.19%9.23%13.02%
18Personal Services1.17%7.50%9.88%
19Beverages - Wineries & Distillers1.15%2.35%7.25%
20Diagnostic Substances1.11%12.98%17.42%
21Personal Products1.09%2.88%0.63%
22Food Wholesale0.89%-0.64%0.45%
23Business Equipment0.87%1.26%-7.26%
24Electronics Wholesale0.84%5.88%-2.67%
25Auto Parts Stores0.82%5.65%9.48%

Best Equities Performance

Looking into best weekly stocks can provide an insight what stock market will bring for the next session.

August 8, 2015

Top 10 Inflation Protected Bond ETFs in 2015

Find top 10 inflation protected bond ETFs in 2015. These best exchange traded funds are FlexShares iBoxx 5-Year Target Duration TIPS Index Fund, SPDR Barclays 1-10 Year TIPS ETF.

Best Debt Funds

These inflation protected bond ETFs own Treasury Inflation Protected Securities. Treasury bonds and notes typically involve principal and coupon payments step up with the cost of living. Depending on the funds, some ETFs are index ETFs.

These top inflation protected bond funds are selected based on its YTD performance in 2015. Unlike mutual fund, these exchange traded funds don’t have a sales load or a transaction fee. You can find the fund review and other fund information below such as the yield, expense ratio, fund manager, top holdings, top sectors, etc.

Top 10 inflation protected bond ETFs in 2015 are:
    Top 10 Inflation Protected Bond ETFs 2015
  1. FlexShares iBoxx 5-Year Target Duration TIPS Index Fund (TDTF)
  2. SPDR Barclays 1-10 Year TIPS ETF (TIPX)
  3. Vanguard Short-Term Inflation-Protected Securities ETF (VTIP)
  4. FlexShares iBoxx 3-Year Target Duration TIPS Index Fund (TDTT)
  5. iShares 0-5 Year TIPS Bond ETF (STIP)
  6. PIMCO 1-5 Year US TIPS ETF (STPZ)
  7. SPDR Barclays 0-5 Year TIPS ETF (SIPE)
  8. iShares TIPS Bond ETF (TIP)

August 6, 2015

PIMCO Dynamic Income Fund (PDI)

PIMCO Dynamic Income Fund (PDI) is a popular multisector bond closed end fund. This debt fund provide high yield of income.

The fund objective is to provide income with capital growth. It invests mainly in a global portfolio of debt obligations and other income-producing securities of any type and credit quality, with varying maturities and related derivative instruments. The fund managers are Joshua Anderson, Daniel J Ivascyn, and Alfred T. Murata.

This bond fund has a high yield of 8.67%. It has $2.58 billion of assets. This PIMCO fund has a high expense fee of 3.11%. The current market price is trading at 6.62% discount to its NAV. The effective leverage is 45.22%

PDI Fund Profile

    PIMCO Dynamic Income Fund (PDI)
  • Fund Inception Date: 05/25/2012
  • Ticker Symbol: PDI
  • CUSIP: 72201Y101
  • Rank in category (YTD): 12%
  • Category: Multisector Bond
  • Yield: 8.67%
  • Effective Leverage: 45.22%
  • Capital Gains: -
  • Premium/ Discount: -6.62%
  • Base Expense Ratio: 2.12%
  • Net Assets: $ 2.58 billion

August 5, 2015

Top 15 US Stocks Mutual Funds in 2015

Find top 15 US stocks mutual funds in 2015. Best funds are Driehaus Micro Cap Growth fund, Turner Small Cap Growth Fund.

Best US Equity Funds

US stock mutual funds invest in US companies. The funds may invest in small cap, mid cap, and large cap stocks.

You can buy these top mutual funds for your brokerage account, retirement account (IRA), and 401k account. The minimum initial funding may be as little as $100 for retirement account. These top US stock mutual funds in 2015 are sorted based on its year to date performance in 2015 (up to July 19, 2015). You can find the fund review below as well.

Top 15 US stocks mutual funds in 2015 are:
    Top 15 US Stocks Mutual Funds in 2015
  1. Driehaus Micro Cap Growth Fund (DMCRX)
  2. Turner Small Cap Growth Fund (TSCEX)
  3. Meyers Capital Aggressive Growth Fund (MAGFX)
  4. Federated Kaufmann Small Cap Fund (FKASX)
  5. Tocqueville Opportunity Fund (TOPPX)
  6. Oberweis Small-Cap Opportunities Fund (OBSOX)
  7. Emerald Growth A (HSPGX)
  8. Tanaka Growth Fund (TGFRX)
  9. Morgan Stanley Institutional Opportunity Fund (MEGPX)
  10. Lazard US Small Cap Equity Growth Open (GRWOX)

August 4, 2015

Foreign Money Center Banks Stocks

Foreign Money Center Banks stocks are part of financial stock sector. Foreign money center banks are banks that offer financial services in foreign countries. Many times these banks are multinationals and service many different countries.

These companies often times trade as ADRs (American Depository Receipts), which means they are foreign companies traded in the United States. Foreign money centers tend to offer above-average dividend yields than companies in S&P 500 index.

Companies List

Foreign money center banks are typically located in the financial center around the world such as London, Zurich, etc. These foreign money center banks are HSBC Holdings plc, and Banco Santander, S.A.

Foreign money center banks companies are:
    Foreign Money Center Banks Stocks
  1. HSBC Holdings plc (HSBC)
  2. Banco Santander, S.A. (SAN)
  3. Lloyds Banking Group plc (LYG)
  4. UBS Group AG (UBS)
  5. Westpac Banking Corporation (WBK)
  6. Barclays PLC (BCS)
  7. The Royal Bank of Scotland Group plc (RBS)
  8. Credit Suisse Group AG (CS)
  9. East West Bancorp, Inc. (EWBC)
  10. Banco Latinoamericano de Comercio Exterior, S.A (BLX)

August 3, 2015

Fidelity Online Brokerage Review

Fidelity Investments is well known among investors and traders. Fidelity is considered as a full service broker. It has more than 15 million brokerage accounts & $1.5 trillion of client assets as of July 1, 2015. Fidelity provides variety of product & service offerings. It offers investment guidance and retirement services.

Fidelity Brokerage Profile

  • Products: Stocks, bonds, mutual funds, annuities, insurance, commercial paper, CDs, IPOs, precious metals, managed portfolios
  • Stock Orders: $7.95 per trade
  • ETF Orders: $7.95 per trade
  • Limit Orders: $7.95 per trade
  • Phone FAST Orders: $12.95 per trade
  • Broker Assisted: $32.95 per trade
  • ishares ETFs Orders: $0.00 for iShares & Fidelity ETFs
  • Mutual Funds: $0.00 for Fidelity & NTF funds. Non-NTF: $49.95.
  • Options: $7.95/trade+$0.75/contract
  • Minimum to Open: $2500
  • Inactivity Fee: $0.00
  • Some Other Fees: Tender Fee: $38.00.
  • Maximum Margin Rate: Based on proprietary base rate.

Commissions & Fees

Fidelity uses a simple, flat-fee trading commission structure. Stock trades are $7.95 per trade, and option trades run at $7.95, plus $.75 per contract. These types of commissions are similar to those found at TD Ameritrade, ETRADE, Charles Schwab, and

August 2, 2015

Stocks Close Higher Due to Earnings in July

Most stocks close higher due to earnings in July 2015. Will the stocks move up again for next month? Top stock market industries in week 31, 2015 are Air Delivery & Freight Services, and Trucking.

Top Transportation Stocks

Transportation StocksThis post will look into the top performing stocks, industry, and sector. The S&P 500 index has a weekly return of 1.19%. NASDAQ Composite has a weekly return of 0.78%. Dow Jones Industrials Average has a weekly return of 0.69%. The small cap (Russell 2000) has a return of 1.05%.

Top 25 stock industries in week 31, 2015 (July 27, 2015 to August 2, 2015) are:

No.NamePerf Week
1Office Supplies9.21%
2Computers Wholesale9.21%
3Confectioners6.52%
4Air Delivery & Freight Services6.47%
5Trucking6.26%
6Publishing - Periodicals6.25%
7Electronics Wholesale5.61%
8General Contractors5.44%
9Security & Protection Services5.28%
10Aerospace/Defense - Major Diversified5.22%
11Computer Based Systems5.00%
12Residential Construction4.95%
13Long-Term Care Facilities4.85%
14Cleaning Products4.84%
15Data Storage Devices4.73%
16Research Services4.67%
17Textile Industrial4.62%
18Drug Manufacturers - Other4.49%
19Waste Management4.28%
20Industrial Metals & Minerals4.18%
21General Building Materials4.12%
22Tobacco Products, Other4.07%
23Food - Major Diversified4.01%
24Railroads3.87%
25Technical Services3.85%
26Rental & Leasing Services3.84%

Best Stock Industries

Looking into best weekly stocks can provide an insight what stock market will bring for the next session. Retail or institutional investors may want to rotate to this sector to avoid bad returns. Can growth stocks finally make the comeback?

The Importance of Diversification in Investing

Diversification is a key principle in investing, and it's especially important in today's uncertain economic climate. By spreading y...