 Best Performing Bond ETFs
Intermediate-term bond fund utilizes its assets to purchase a portfolio of high quality corporate and government debts with durations of 3.5 to 6 years. This intermediate-term bond fund has a higher yield than short term bond fund. It is also less sensitive to interest rates than long term bond fund. Most of the intermediate term bond ETFs funds are index bond fund with low expense rate fee.These top performer ETFs are sorted based on its 1 year return (up to August 1, 2013). You can find the best exchange traded fund review from this article. Other fund information can be found below such as expense ratio, Morningstar rating, fund’s NAV, managers, fund’s holdings, yield, etc.
Top performer intermediate term bond ETFs 2013 are:
- iShares Core Total US Bond Market ETF (AGG)
- Vanguard Intermediate-Term Bond ETF (BIV)
- Vanguard Total Bond Market ETF (BND)
- PIMCO Total Return ETF (BOND)
- Guggenheim BulletShares 2015 Corp Bond (BSCF)
- Guggenheim BulletShares 2016 Corp Bond (BSCG)
- Guggenheim BulletShares 2017 Corp Bond (BSCH)
- Guggenheim BulletShares 2018 Corp Bond (BSCI)
- Guggenheim BulletShares 2019 Corp Bond (BSCJ)
- Guggenheim BulletShares 2020 Corp Bond (BSCK)
- iShares Barclays Credit Bond (CFT)
- iShares Barclays Intermediate Credit Bond (CIU)
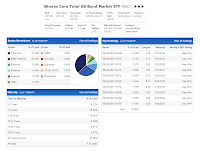
 iShares Core Total US Bond Market ETF (AGG)
The objective of this top performer intermediate term bond ETF is to seek investment results that correspond to the price and yield performance of the Barclays US Aggregate Bond Index. This iShares Core Total US Bond Market ETF fund was introduced to public in 2003. It has large total net assets of $14.69 billion. The annual expense ratio is quite low, only 0.16%. Its dividend yield is 2.45%.More: Best Performing Intermediate Term Bond ETFs May 2013
Morningstar analysts rank this exchange traded fund with 3-stars rating. It has an average maturity of 6.75 years and an effective duration of 5.43 years. The fund has returned 3.76% in 2012 and 7.69% in 2011. The fund has also returned 5.26% over the past 5-year.
The top 3 sector breakdowns as of July 18, 2013 are Treasuries (37.42%), MBS (28.50%) and Industrial (12.02%).
Vanguard Intermediate-Term Bond ETF (BIV)
The Vanguard Intermediate-Term Bond ETF invests the portfolio of the fund in U.S. government high-quality corporate and investment-grade international dollar-denominated bonds. The total net assets are $4.0 billion. The fund has 0.10% annual expense ratio. The yield is 3.06%. The fund is currently trading 0.04% discount to its NAV.More: Top Performing Intermediate Term Bond Mutual Funds March 2013
Since the inception in 2007, the fund’s performance is as below:
- Year 2008: 7.77%
- Year 2009: 3.89%
- Year 2010: 9.14%
- Year 2011: 11.13%
- Year 2012: 6.80%
PIMCO Total Return ETF (BOND)
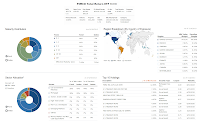
 As part of PIMCO fund family, this PIMCO Total Return ETF fund has large assets of $4.29 billion. The objective is to seek maximum total return, consistent with preservation of capital and prudent investment management. The fund has SEC yield of 1.74%. The annual expense ratio is 0.55%. As of July 22, 2013, the fund is sold at $106.01. The CUSIP is 72201R775.
This best performing bond fund has YTD return of -1.72%. It has returned 2.01% over the past 1-year. The fund manager is William H. Gross. Since it is new in the market (incepted in 2012), there is no Morningstar rating yet. As of July 2013, the fund has a total of 928 holdings. The top holdings are FNMA TBA (17.85%), US Treasury Inflation Protected Bond (7.46%) and US Treasury Note (7.33%).
ETFs Profile
| No | Fund Description | Ticker | Rating | Expense Ratio | Yield | Assets |
|---|---|---|---|---|---|---|
| 1 | iShares Core Total US Bond Market ETF | AGG | 3 | 0.16% | 2.45% | $14,690.00 |
| 2 | Vanguard Intermediate-Term Bond ETF | BIV | 4 | 0.10% | 3.06% | $4,080.00 |
| 3 | Vanguard Total Bond Market ETF | BND | 3 | 0.10% | 2.53% | $16,750.00 |
| 4 | PIMCO Total Return ETF | BOND | N/A | 0.55% | 2.19% | $4,280.00 |
| 5 | Guggenheim BulletShares 2015 Corp Bond | BSCF | 3 | 0.24% | 1.78% | $299.90 |
| 6 | Guggenheim BulletShares 2016 Corp Bond | BSCG | 4 | 0.24% | 2.04% | $271.69 |
| 7 | Guggenheim BulletShares 2017 Corp Bond | BSCH | 4 | 0.24% | 2.30% | $275.45 |
| 8 | Guggenheim BulletShares 2018 Corp Bond | BSCI | N/A | 0.24% | 1.87% | $108.65 |
| 9 | Guggenheim BulletShares 2019 Corp Bond | BSCJ | N/A | 0.24% | 2.38% | $61.45 |
| 10 | Guggenheim BulletShares 2020 Corp Bond | BSCK | N/A | 0.24% | 2.86% | $45.89 |
ETFs Fund Returns
| No | Fund Description | Ticker | YTD | 1-Year | 3-Year | 5-Year |
|---|---|---|---|---|---|---|
| 1 | iShares Core Total US Bond Market ETF | AGG | -2.33% | -1.88% | 3.06% | 5.20% |
| 2 | Vanguard Intermediate-Term Bond ETF | BIV | -3.37% | -2.03% | 4.87% | 6.94% |
| 3 | Vanguard Total Bond Market ETF | BND | -2.32% | -1.75% | 3.23% | 5.22% |
| 4 | PIMCO Total Return ETF | BOND | -1.97% | 1.82% | N/A | N/A |
| 5 | Guggenheim BulletShares 2015 Corp Bond | BSCF | 0.79% | 2.63% | 4.12% | N/A |
| 6 | Guggenheim BulletShares 2016 Corp Bond | BSCG | 0.73% | 2.92% | 5.12% | N/A |
| 7 | Guggenheim BulletShares 2017 Corp Bond | BSCH | -0.49% | 2.50% | 5.58% | N/A |
| 8 | Guggenheim BulletShares 2018 Corp Bond | BSCI | -0.83% | 3.02% | N/A | N/A |
| 9 | Guggenheim BulletShares 2019 Corp Bond | BSCJ | -1.32% | 2.06% | N/A | N/A |
| 10 | Guggenheim BulletShares 2020 Corp Bond | BSCK | -2.54% | 0.65% | N/A | N/A |
| 11 | iShares Barclays Credit Bond | CFT | -2.80% | -1.19% | 5.07% | 6.72% |
| 12 | iShares Barclays Intermediate Credit Bd | CIU | -1.44% | 1.02% | 4.25% | 6.03% |
| 13 | iShares Barclays CMBS Bond | CMBS | -0.39% | 3.11% | N/A | N/A |
| 14 | PIMCO Investment Grade Corp Bd Index ETF | CORP | -3.22% | -0.94% | N/A | N/A |
| 15 | iShares Barclays Government/Credit Bond | GBF | -2.40% | -2.60% | 3.39% | 5.15% |
| 16 | Guggenheim Enhanced Core Bond | GIY | -3.30% | -3.41% | 2.32% | 4.43% |
| 17 | Columbia Core Bond ETF | GMTB | -2.47% | -2.17% | 3.82% | N/A |
| 18 | iShares Barclays Interm Govt/Credit Bond | GVI | -1.13% | -0.49% | 2.79% | 4.52% |
| 19 | SPDR Barclays Cap Interm Term Corp Bnd | ITR | -1.77% | 0.86% | 4.41% | N/A |
| 20 | SPDR Barclays Aggregate Bond | LAG | -2.64% | -2.04% | 3.19% | 5.30% |


No comments:
Post a Comment